Posts Tagged with "failure rate"

既に発行済みのブログであっても適宜修正・追加することがあります。
We may make changes and additions to blogs already published.
posted by sakurai on December 20, 2024 #912

それでは現実の回路でのトライアルを行います。まず受動部品から成るエレメントELEM1を取り上げます。 受動部品には以下のように抵抗とキャパシタが含まれます。

部品番号部品種類故障率[FIT]
C1000Capacitor0.065
C1001Capacitor0.065
R1000Registor0.011
R1001Registor0.011
R1002Registor0.011
R1003Registor0.011
C1010Capacitor0.065
C1011Capacitor0.065
R1010Registor0.011
R1011Registor0.011
R1012Registor0.011
R1013Registor0.011

原始シート準備

エクセルシートを新規に開き、部品情報をSheet1のA1からB12まで並べます。並べるとSheet1は以下の図のようになります。

図%%.1
図912.1 Sheet1の表

BED

準備としてSheet2に基本事象の部分を作成します。A1セルに

=IF(Sheet1!A1<>"",CONCATENATE(Sheet1!A1,", ",Sheet1!A1," ",Sheet1!B1,", TEST"),"")

この式を入れ行コピーを必要分行います。するとSheet2は以下の図のようになります。

図%%.2
図912.2 Sheet2の表

Sheet2をコピーし、以下のようにBEDファイルの* Name ...のコメント行以下にペーストします。

*Saphire 8.2.9
TEST =
* Name , Descriptions , Project
C1000, C1000 Capacitor, TEST
C1001, C1001 Capacitor, TEST
R1000, R1000 Resistor, TEST
R1001, R1001 Resistor, TEST
R1002, R1002 Resistor, TEST
R1003, R1003 Resistor, TEST
C1010, C1010 Capacitor, TEST
C1011, C1011 Capacitor, TEST
R1010, R1010 Resistor, TEST
R1011, R1011 Resistor, TEST
R1012, R1012 Resistor, TEST
R1013, R1013 Resistor, TEST

図912.3 生成FT用BED

BEI

準備としてSheet3に基本事象情報の部分を作成します。A1セルに

=IF(Sheet1!A1<>"",CONCATENATE(Sheet1!A1, ", 3, , , 0.000E+000, 0.000E+000, ",Sheet1!C1,"E-9",", 0.000E+000, 1.000E+005, , , 0.000E+000, 1.500E-003, ,RANDOM, CD, TEST"),"")

この式を入れ行コピーを必要分行います。するとSheet3は以下の図のようになります。

図%%.3
図912.4 Sheet3の表

Sheet3をコピーし、以下のようにBEIファイルの* Name ...のコメント行以下にペーストします。

*Saphire 8.2.9
TEST =
* Name ,FdT,UdC ,UdT, UdValue, Prob, Lambda, Tau, Mission, Init,PF, UdValue2, Calc. Prob, Freq, Analysis Type , Phase Type , Project
C1000, 3, , , 0.000E+000, 0.000E+000, 0.065E-9, 0.000E+000, 1.000E+005, , , 0.000E+000, 1.500E-003, ,RANDOM, CD, TEST
C1001, 3, , , 0.000E+000, 0.000E+000, 0.065E-9, 0.000E+000, 1.000E+005, , , 0.000E+000, 1.500E-003, ,RANDOM, CD, TEST
R1000, 3, , , 0.000E+000, 0.000E+000, 0.011E-9, 0.000E+000, 1.000E+005, , , 0.000E+000, 1.500E-003, ,RANDOM, CD, TEST
R1001, 3, , , 0.000E+000, 0.000E+000, 0.011E-9, 0.000E+000, 1.000E+005, , , 0.000E+000, 1.500E-003, ,RANDOM, CD, TEST
R1002, 3, , , 0.000E+000, 0.000E+000, 0.011E-9, 0.000E+000, 1.000E+005, , , 0.000E+000, 1.500E-003, ,RANDOM, CD, TEST
R1003, 3, , , 0.000E+000, 0.000E+000, 0.011E-9, 0.000E+000, 1.000E+005, , , 0.000E+000, 1.500E-003, ,RANDOM, CD, TEST
C1010, 3, , , 0.000E+000, 0.000E+000, 0.065E-9, 0.000E+000, 1.000E+005, , , 0.000E+000, 1.500E-003, ,RANDOM, CD, TEST
C1011, 3, , , 0.000E+000, 0.000E+000, 0.065E-9, 0.000E+000, 1.000E+005, , , 0.000E+000, 1.500E-003, ,RANDOM, CD, TEST
R1010, 3, , , 0.000E+000, 0.000E+000, 0.011E-9, 0.000E+000, 1.000E+005, , , 0.000E+000, 1.500E-003, ,RANDOM, CD, TEST
R1011, 3, , , 0.000E+000, 0.000E+000, 0.011E-9, 0.000E+000, 1.000E+005, , , 0.000E+000, 1.500E-003, ,RANDOM, CD, TEST
R1012, 3, , , 0.000E+000, 0.000E+000, 0.011E-9, 0.000E+000, 1.000E+005, , , 0.000E+000, 1.500E-003, ,RANDOM, CD, TEST
R1013, 3, , , 0.000E+000, 0.000E+000, 0.011E-9, 0.000E+000, 1.000E+005, , , 0.000E+000, 1.500E-003, ,RANDOM, CD, TEST

図912.5 生成FT用BEI

FTD

FTDは他のファイルと同一の以下のようなファイルです。

TEST =
* Name , Description, SubTree, Alternate, Project
ELEM1, PVSG of ELEM1 , , , TEST

図912.6 生成FT用FTD

FTL

FTLはシンプルなので、エクセルシートで事前生成をする必要はありません。Sheet1のA列のみを以下のようにFTLの3行目の"ELEM1 OR"の次の行からコピーします。

TEST, ELEM1=
ELEM1 OR
C1000
C1001
R1000
R1001
R1002
R1003
C1010
C1011
R1010
R1011
R1012
R1013
^EOS

図912.7 生成FT用FTL

GTD

中間ゲートが無いため本ファイルは不要です。

MARD

MARDを図912.7に示します。

TEST_Subs\TEST.BED
TEST_Subs\TEST.BEI
TEST_Subs\TEST.FTD
TEST_Subs\TEST.FTL

図912.7 ターゲットFT用MARD

左矢前のブログ 次のブログ右矢

Fault treeの自動生成

posted by sakurai on December 18, 2024 #911

はじめに

過去記事の再トライアルとなります。なぜ再トライアルかというと、4年が経ちSAPHIREの版数も上がったので、ファイルに互換性が無くなったようです。そのためFault Treeを外部から生成する方法を本記事で確立します。

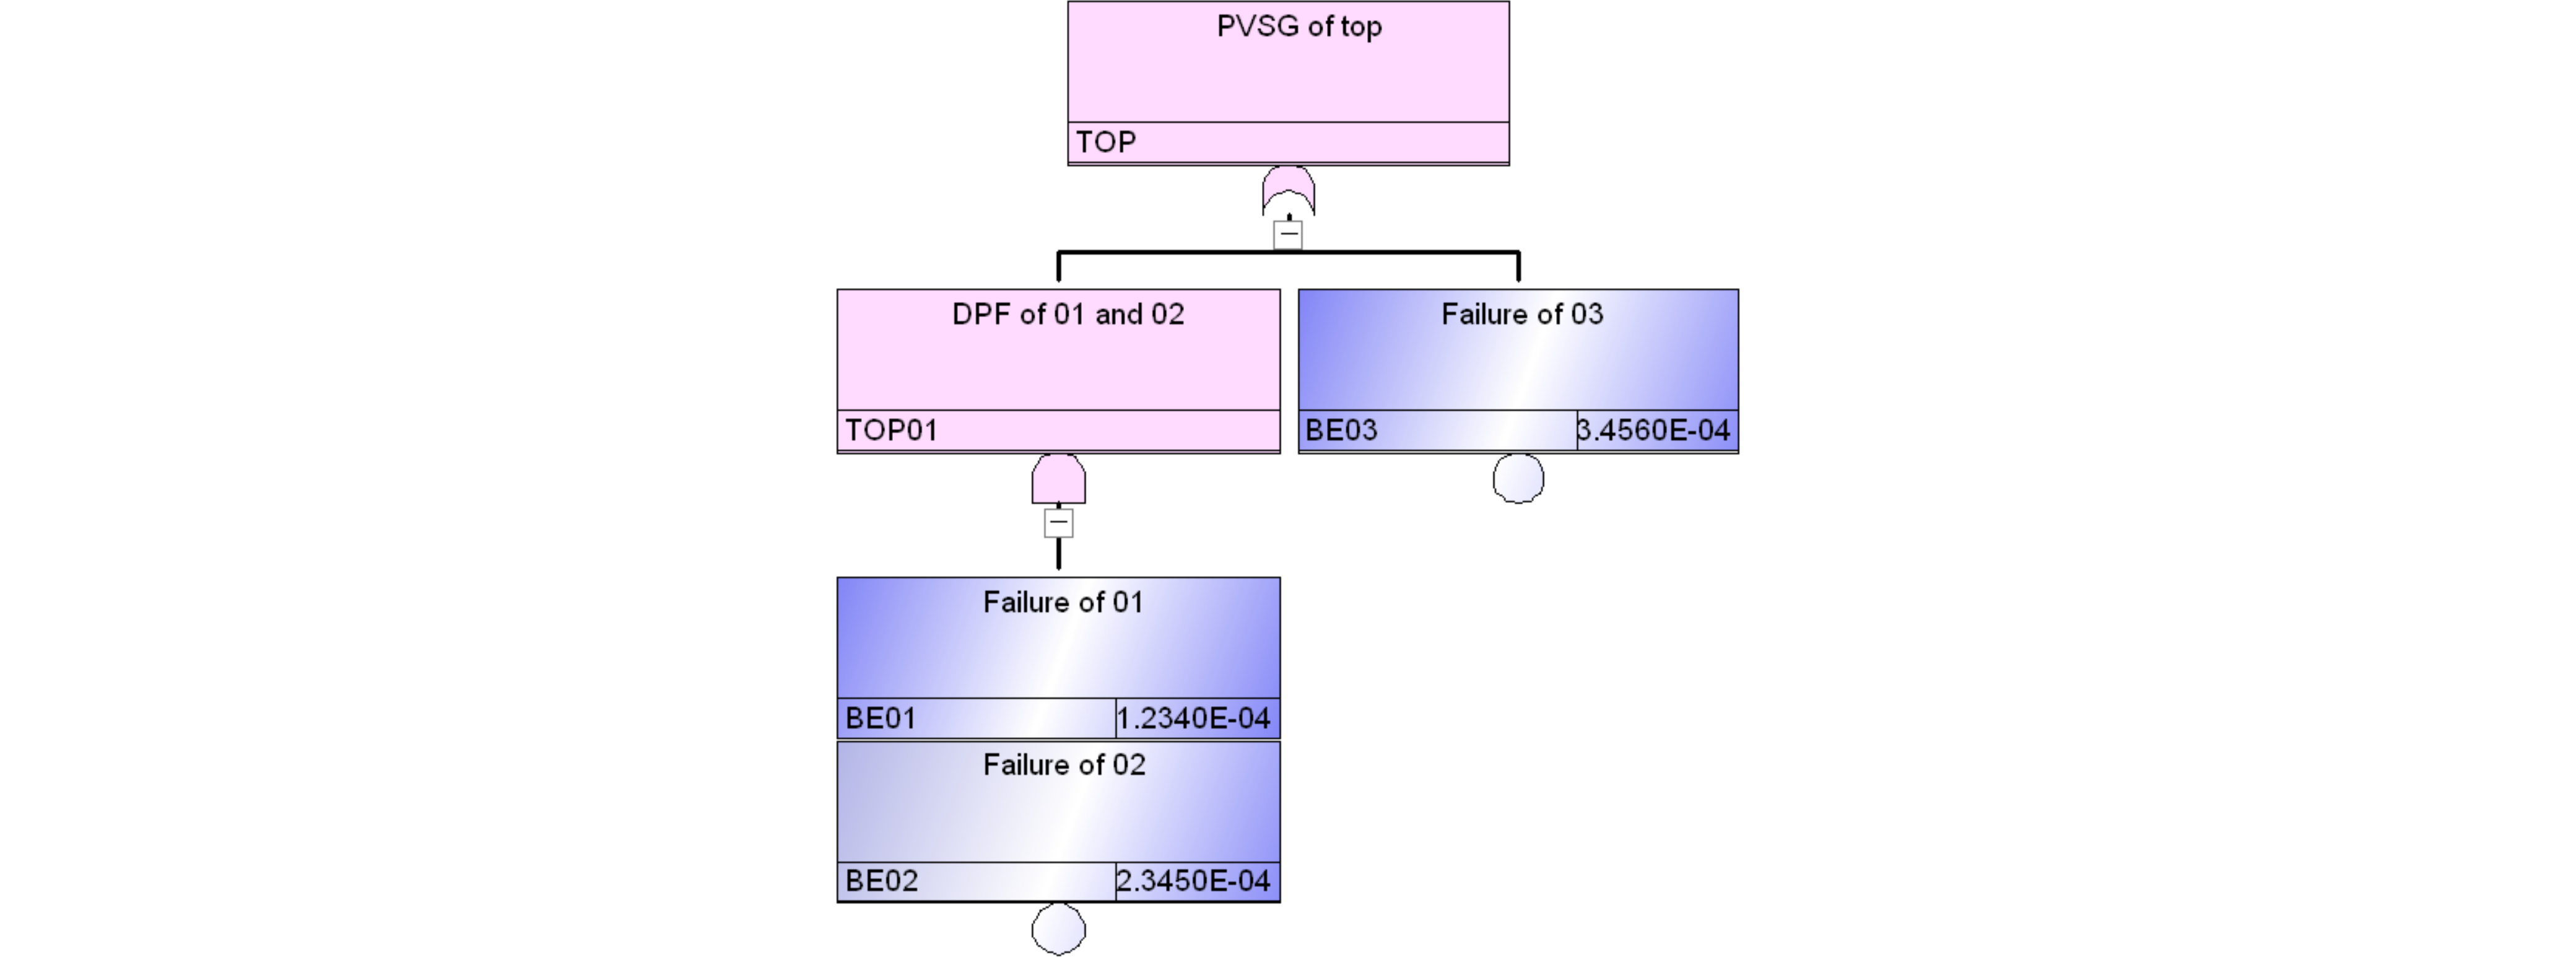
過去記事で「MAR-D(各種データ)の一括インポートにより、完全なFTが構成できるようです。」と書きましたが、これは変わりません。また対象FTも同一のもの(図911.1)とします。

図%%.1
図911.1 ターゲットのFT

図911.1のFTをテキストファイルで入力するためには

  • .BED --- Basic Eventの説明等の記述
  • .BEI --- Basic Eventの情報、故障率やミッション時間等
  • .FTD --- Fault Treeの説明等の記述
  • .FTL --- 木の構造
  • .GTD --- Top Event、中間ゲートの説明等の記述
  • .MARD --- 上記5種のリストを記述

の6種のファイルが必要です。図911.2~911.6に示すファイルを用意し、そのリストを図911.7のMARDファイルとしてMARDをloadすると、図911.1のFTが生成されました。以下に一つずつ文法例を解説します。先頭に*がある行はコメント行を表します。

BED

図911.2のBEDは基事象の定義で、3種類の基事象の名前と説明を記述します。

*Saphire 8.2.9
TEST =
* Name , Descriptions , Project
BE01 , Failure of 01 , TEST
BE02 , Failure of 02 , TEST
BE03 , Failure of 03 , TEST
TOP , PVSG of top , TEST

図911.2 ターゲットFT用BED

BEI

図911.3のBEIは基事象の故障モデル、故障率、ミッション時間を記述します。赤字は故障率、青字はミッション時間です。

*Saphire 8.2.9
TEST =
* Name ,FdT,UdC ,UdT, UdValue, Prob, Lambda, Tau, Mission, Init,PF, UdValue2, Calc. Prob, Freq, Analysis Type , Phase Type , Project
BE01 , 3, , , 0.000E+000, 0.000E+000, 1.234E-009, 0.000E+000, 1.000E+005, , , 0.000E+000, 1.234E-004, , RANDOM , CD , TEST
BE02 , 3, , , 0.000E+000, 0.000E+000, 2.345E-009, 0.000E+000, 1.000E+005, , , 0.000E+000, 2.345E-004, , RANDOM , CD , TEST
BE03 , 3, , , 0.000E+000, 0.000E+000, 3.457E-009, 0.000E+000, 1.000E+005, , , 0.000E+000, 3.456E-004, , RANDOM , CD , TEST
TOP , 1, , , 0.000E+000, 1.000E+000, 0.000E+000, 0.000E+000, 0.000E+000, , , 0.000E+000, 1.000E+000, , RANDOM , CD , TEST

図911.3 ターゲットFT用BEI

ここで、図911.3中のFdtは、表911.1(一部のみ)により規定される故障計算タイプです。

表911.1
故障計算タイプ記号 故障計算タイプ説明 数値説明
1 確率 DC等の確率
3 指数分布($1-e^{^-\lambda t}$) 故障率$\lambda$、ミッション時間$T_\text{lifetime}$

図911.4はFT全体の定義を示すFTDファイルで、FTの名前と説明を記述します。

TEST =
* Name , Description, SubTree, Alternate, Project
TOP , PVSG of top , , , TEST

図911.4 ターゲットFT用FTD

FTL

図911.5にFTの木構造であるFTLを記述します。

TEST, TOP =
TOP OR TOP0 BE03
TOP0 AND BE01 BE02
^EOS

図911.5 ターゲットFT用FTL

GTD

図911.6のGTDにゲートの名前と説明を記述します。

TEST=
* Name , Description, Project
TOP, PVSG of top, ,TEST
TOP0, DPF of 01 and 02, ,TEST
TOP01, DPF of 01 and 02, ,TEST

図911.6 ターゲットFT用GTD

MARD

最後のMARDを図911.7に示します。前述のように、TESTフォルダのSubsフォルダに各種ファイルをまとめ、一括ロードするためのリストです。

TEST_Subs\TEST.BED
TEST_Subs\TEST.BEI
TEST_Subs\TEST.FTD
TEST_Subs\TEST.FTL
TEST_Subs\TEST.GTD

図911.7 ターゲットFT用MARD

おわりに

ツールの入力としてはDescriptionに日本語が入るようになって便利にはなりました。一方でimportにおいては日本語が化けるため、自動生成の場合、Descriptionに日本語が使用できません。4年前に日本語入力を依頼した時点では、日本語の入力の改修に対してネガティブな返答でしたが、機会があれば要求したいと思います。


左矢前のブログ 次のブログ右矢

PMHFの計算法の例 (3)

posted by sakurai on October 21, 2020 #327

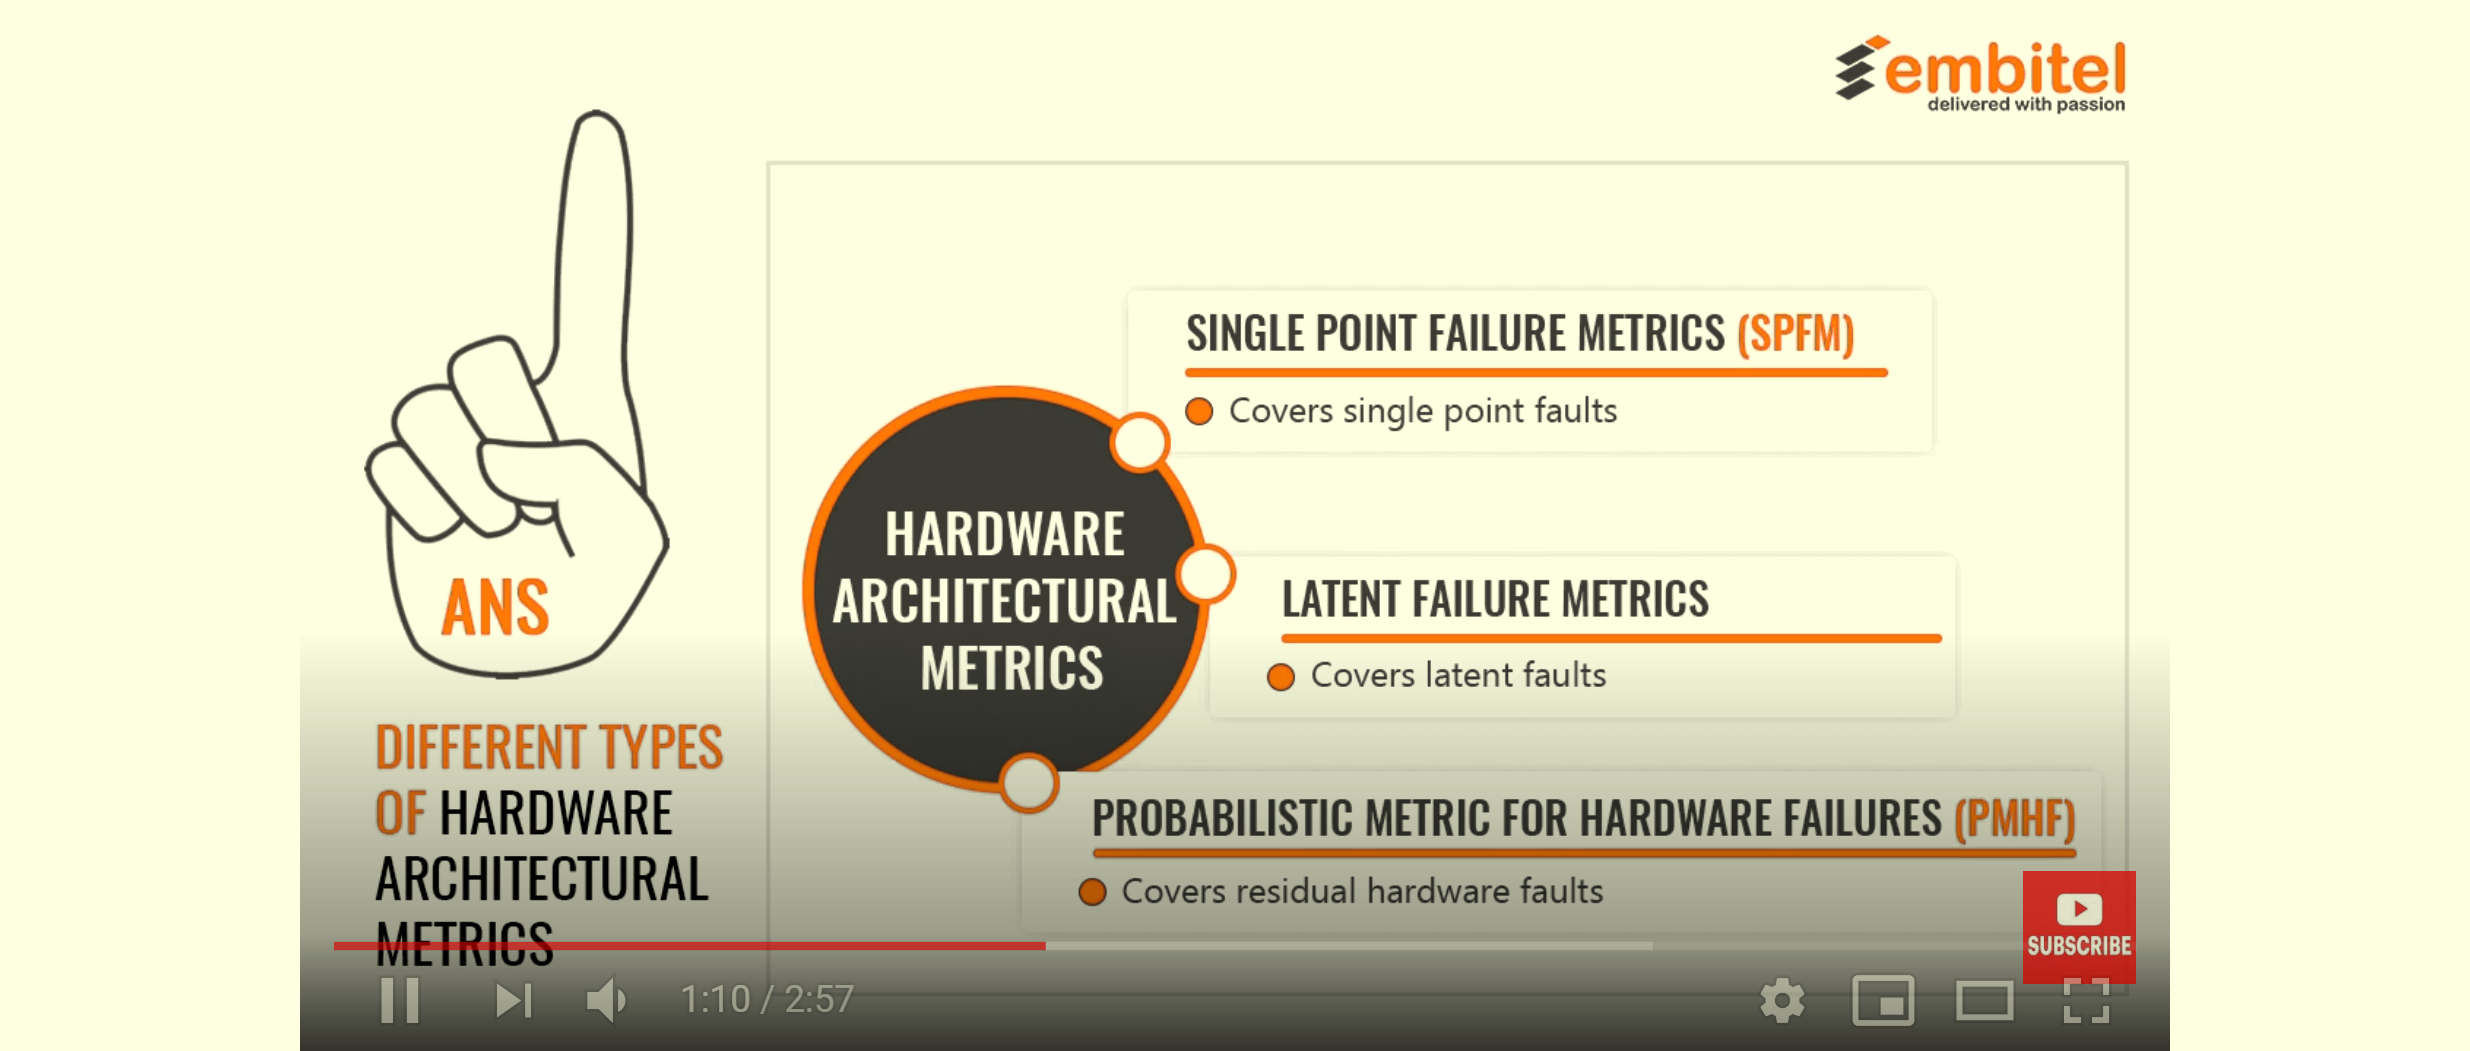
こんどはYoutubeでおかしな表現を見つけました。図327.1に当該部分を引用します。

図%%.1
図327.1 あるYoutube動画中のPMHFの説明
  • SPFMの説明にはSPFをカバーすると書かれています。SPFは広義ではRFを含むこともあり、広義と教義があるので、広義だとすれば問題ありません。
  • LFMの説明にはなぜかLFMと書かれていません。説明はLFをカバーすると書かれており、OKです。カバレージの意味もあるのかもしれませんが。
  • PMHFの説明には、残余ハードウエアフォールトをカバーすると書かれています。通常はRFのことなので、ここにおいて最初のSPFの説明にRFが含まれなかった、つまり狭義のSPFだったことがわかります。

以上から、SPFMとPMHFの説明は誤りです。ただしくは、SPFMはSPF及びRFの両方のカバレージを意味します。さらに、PMHFはアイテムの車両寿命におけるダウン確率の時間平均を意味します。

この動画はあまり良くなく、FMEDAでSPFM/LFM/PMHFを計算すると言っています。原理的にFMEDAではPMHFを正しく計算するのは困難です。ワーストケースと思えば良いかもしれません。それにしても規格式を正しく実装しているかどうかが不明です。この動画は、自社のツールを使えば、ブラックボックスでアーキテクチャメトリクスが計算できると言っているにすぎません。

Youtubeで調べましたが、正しいPMHFの計算法を紹介している動画は見つかりませんでした。


左矢前のブログ 次のブログ右矢

posted by sakurai on September 3, 2020 #308

FTA

A. 定量的な FTA の適用可能性と使用の制限

PMHF論文das2016$\dagger$の続きです。

以下の段落では一般論を述べています。

Quantitative methodologies are a useful tool in safety assurance processes, where the objective is to reduce risk to a quantifiably acceptable level by estimating the rates of occurrence of hazardous events. Standards such as IEC 61508 are based strongly on this principle. Given such an estimate of the probability of safety-related hazards, the risk can in principle be mitigated to an acceptably low level.

定量的方法論は、危険事象の発生率を推定することにより、リスクを定量的に許容できるレベルまで低減することを目的とした安全保証プロセスにおいて有用なツールである。IEC 61508 などの規格は、この原則に強く基づいている。安全に関連するハザードの発生確率をこのように推定すれば、原則としてリスクは許容可能な低レベルにまで軽減することができる。

以下の段落ではシステマティックフォールトを混ぜて議論していますが、混ぜるとわけがわからなくなります。対処する手法が異なるからです。ここではランダムハードウェア故障に絞って議論したほうが良いでしょう。  

However, there are several critical limitations to such methods that must be recognized. While random failures in electronic hardware may be modeled with probabilistic methods, systematic failures (for example in deterministic software) cannot be modeled in this way. This may lead the analyst to under-represent or overlook important systematic failures [8]. There is wide variability in underlying data available for the reliability failure of electronic components, which in turn leads to calculations with a relatively wide range of uncertainty. There is also evidence of a tendency for the analyst to believe in the independence of events which are represented independently in the FTA, while objective observation would find a correlation between events [9]. ISO 26262 takes steps to mitigate these limitations, for example by recognizing the primacy of process adherence in preventing and avoiding systematic faults, which are not generally quantifiable by probabilistic methods. It is important to remember that analyst judgment is a critical factor in the success of a quantified FTA. The analysis is neither a formal proof nor a validation of safety, but merely a structured record of the analyst's best understanding.

しかし、このような方法には、認識しなければならないいくつかの重大な限界がある。電子ハードウェアのランダムな故障は確率論的手法でモデル化することがでるが、系統的な故障(例えば決定論的ソフトウェア)はこの方法ではモデル化できません。このため、解析者は重要なシステマティックな故障を過小評価したり、見落としたりする可能性がありる[8]。電子部品の信頼性故障について利用可能な基礎データには大きなばらつきがあり、その結果、比較的広い範囲の不確実性を伴う計算が行われることになる。また、客観的な観察ではイベント間の相関関係を見つけることができるのに対し、分析者は、FTA で独立して表現されているイベントの独立性を信じる傾向があるという証拠もある[9]。ISO 26262 は、確率論的手法では一般的に定量化できないシステマティックな欠陥の予防と回避において、プロセスの堅持が重要であることを認識するなど、これらの制限を緩和するための措置を講じている。分析者の判断が定量化された FTA を成功させるための重要な要素であることを覚えておくことが重要である。解析は、安全性の正式な証明でも検証でもなく、解析者の最善の理解を構造化した記録に過ぎない。


$\dagger$N. Das and W. Taylor, "Quantified fault tree techniques for calculating hardware fault metrics according to ISO 26262," 2016 IEEE Symposium on Product Compliance Engineering (ISPCE), Anaheim, CA, 2016, pp. 1-8, doi: 10.1109/ISPCE.2016.7492848.


左矢前のブログ 次のブログ右矢

posted by sakurai on September 2, 2020 #307

FTA

PMHF論文das2016$\dagger$の続きです。

FTAの説明と、それによるPMHFの導出の概略を述べています。

FTA is a logical combination of intermediate events and basic events, which can be assembled using AND and OR logical operators to analyze the effects of component faults on system failures. In a safety analysis, the FTA typically begins with a top-level event representing a major hazardous event, and/or the violation of a safety goal or Functional Safety Requirement, as defined in ISO 26262. The analysis is then performed by deducing what conditions or events would lead to the top-level event, and in what logical combination. The method has been in use in industrial settings for several decades (see for example [3], [4], [5]). More recently, the method has been applied to automotive systems [6], [7] and suggested for wider use as an analysis framework. In some cases, the FTA may be qualitative in nature. If probabilities of the underlying lower-level events can be estimated, then an estimate of the probability can be made for the top-level event. The PMHF is just such a quantitative estimation.

FTA は、中間イベントと基本イベントを論理的に組み合わせたもので、AND と OR 論理演算子を使って組み立てることで、コンポーネントの故障がシステムの故障に与える影響を分析することができる。安全解析では、FTAは通常、主要な危険イベントや、ISO 26262で定義されている安全目標や機能安全要件の違反を表すトップレベルのイベントから始まる。次に、どのような条件や事象がトップレベルの事象につながるのか、どのような論理的な組み合わせで行われるのかを推論することで分析が行われる。この手法は、数十年前から産業界で使用されている (例えば [3], [4], [5] を参照)。最近では、この手法が自動車システムに適用され [6], [7]、解析フレームワークとしての幅広い利用が提案されています。いくつかのケースでは、FTA は定性的な性質を持っています。もし、基礎となる下位レベルのイベントの確率が推定できれば、上位レベルのイベントの確率を推定することができます。PMHF はまさにそのような定量的な推定である。

本論文は、初版の規格を別にすればPMHF式とFTAを結び付けた初めての論文で、重要論文です。しかしながら1st editionの範囲に留まっています。1st editionの範囲とは、IFがアンリペアラブルという意味です。従って、冗長サブシステムには用いることができません。


$\dagger$N. Das and W. Taylor, "Quantified fault tree techniques for calculating hardware fault metrics according to ISO 26262," 2016 IEEE Symposium on Product Compliance Engineering (ISPCE), Anaheim, CA, 2016, pp. 1-8, doi: 10.1109/ISPCE.2016.7492848.


左矢前のブログ 次のブログ右矢

posted by sakurai on September 1, 2020 #306

イントロダクション

PMHF論文das2016$\dagger$の続きです。

FTAの説明とフレームワークの必要性を述べています。

Fault Tree Analysis (FTA) is a method often proposed for calculation of the PMHF in real-world systems. However, FTA is a very general method, subject to a wide range of interpretations and techniques depending on the objectives of a given problem, the type of failures & faults being considered, and the terminology employed by various industries. There is not yet an accurate and well-explained practical guide to the specific techniques appropriate for PMHF calculation in the automotive industry. For example, large and complex systems, such as those that comprise real-world automotive products, are often difficult to capture in an FTA in a systematic and repeatable way. The use of diagnostic coverage (D.C.) (e.g., by an imperfect safety mechanism which may detect some but not all element faults) is often utilized in hardware metric calculations. However, D.C. concepts are not widely clarified in the industry literature, leaving a gap in understanding for many FTA practitioners. At lower levels of the FTA, specific frameworks for calculating the effect of single-point and dual-point faults (including dual-point latent faults) are necessary to obtain a correct PMHF estimation. All these topics will be addressed here along with a worked automotive example.

フォールトツリー解析(FTA)は、実世界のシステムにおけるPMHFの計算のためにしばしば提案される手法です。しかし、FTAは非常に一般的な手法であり、与えられた問題の目的、考慮される故障や故障の種類、そして様々な業界で採用されている用語に応じて、幅広い解釈や技術の対象となっています。自動車産業におけるPMHF計算に適した特定の技術については、正確かつ十分に説明された実用的なガイドはまだ存在しません。例えば、実際の自動車製品を構成するような大規模で複雑なシステムは、体系的で再現性のある方法でFTAに取り込むことが困難な場合が多い。診断カバレッジ(D.C.)(例えば、一部の要素の故障は検出できるが、すべての要素の故障は検出できない不完全な安全機構)の使用は、しばしばハードウェアメトリックの計算に利用されます。しかし、D.C.の概念は業界の文献では広く明確にされておらず、多くのFTA実務者にとっては理解にギャップがあります。FTA の低レベルでは、正しい PMHF 推定を得るためには、単点および二点故障(二点潜伏故障を含む)の影響を計算するための特定のフレームワークが必要となります。ここでは、これらすべてのトピックについて、実際の自動車の例を挙げながら解説します。


$\dagger$N. Das and W. Taylor, "Quantified fault tree techniques for calculating hardware fault metrics according to ISO 26262," 2016 IEEE Symposium on Product Compliance Engineering (ISPCE), Anaheim, CA, 2016, pp. 1-8, doi: 10.1109/ISPCE.2016.7492848.


左矢前のブログ 次のブログ右矢

PMHF論文das2016 (2)

posted by sakurai on August 31, 2020 #305

イントロダクション

PMHF論文das2016$\dagger$の続きです。

以下の段落はISO 26262の概要です。

The international standard ISO 26262 “Road vehicles - Functional safety” has been released in final form since late 2011 [1]. It provides a standardized set of processes and methods to assure the functional safety of electrical and electronic systems in the automotive domain. The standard is an evolution of the IEC 61508 functional safety standard, applied specifically to the automotive realm [2].

国際規格ISO 26262「道路運送車両-機能安全」は、2011年後半から最終版としてリリースされている[1]。この規格は、自動車分野における電気・電子システムの機能安全を保証するためのプロセスと手法を標準化したものである。この規格は、IEC 61508の機能安全規格を発展させたもので、特に自動車分野に適用されている[2]。

以下の段落はISO 26262の説明です。

ISO 26262 requires a variety of processes and frameworks for safety management, safety concept development, requirements flow-down, and verification & validation activities. The standard also requires quantified metrics to be calculated for safety-related systems.

ISO 26262 は、安全管理、安全コンセプト開発、要求事項のフローダウン、検証・検証活動のためのさまざまなプロセスやフレームワークを要求している。また、安全関連システムの定量化されたメトリクスの計算も要求している。

以下の段落はPMHFの説明です。

Of particular interest is the Probabilistic Metric for Hardware Failure (or PMHF), which represents a calculated estimate of the rate of hazard occurrence due to random hardware failures. This value must be calculated for systems rated at a high Automotive Safety Integrity Level (or ASIL2). Specifically, systems rated at ASIL C or ASIL D must achieve targets such as those proposed by the standard and listed in Table 1.

特に関心が高いのは、ハードウェア故障の確率的指標(PMHF)であり、これは、ランダムなハードウェア故障によるハザード発生率の計算された推定値を表している。 この値は、高いAutomotive Safety Integrity Level(またはASIL2)で評価されたシステムのために計算されなければならない。具体的には、ASIL C または ASIL D に格付けされたシステムは、規格で提案され、表 1 に記載されているような目標を達成しなければならない。


$\dagger$N. Das and W. Taylor, "Quantified fault tree techniques for calculating hardware fault metrics according to ISO 26262," 2016 IEEE Symposium on Product Compliance Engineering (ISPCE), Anaheim, CA, 2016, pp. 1-8, doi: 10.1109/ISPCE.2016.7492848.


左矢前のブログ 次のブログ右矢

PMHF論文das2016

posted by sakurai on August 28, 2020 #304

次にPMHF論文das2016$\dagger$です。この論文は弊社の論文を除き、例外的に1st edition Part10に掲載されているPMHF式に準拠しているものです。それだけでなく、FTAによりPMHF式をどのように実装するかが述べられている実践的なものです。残念ながら、2nd edition発行前の論文であるため、1st editionの範囲でしかなく、冗長サブシステムに対応する形式にはなっていません。

アブストラクト

早速アブストラクトを見てみます。

Since its introduction in 2011, the ISO 26262 standard has provided state-of-the-art methodology for achieving the functional safety of automotive electrical and electronic systems. Among other requirements, the standard requires estimation of quantified metrics such as the Probabilistic Metric for Hardware Failure (PMHF) using quantitative failure analysis techniques. While the standard provides some brief guidance, a complete methodology to calculate the PMHF in detail has not been well described in the literature. This paper will draw out several key frameworks for successfully calculating the probabilistic metric for hardware failure using Fault Tree Analysis (FTA). At the top levels of the analysis, methods drawn from previous literature can be used to organize potential failures within a complex multifunctional system. At the lower levels of the FTA, the effects of all fault categories, including dual-point latent and detected faults, can be accounted for using appropriate diagnostic coverage and proof- test interval times. A simple example is developed throughout the paper to demonstrate the methods. Some simplifications are proposed to estimate an upper bound on the PMHF. Conclusions are drawn related to the steps and methods employed, and the nature of PMHF calculation in practical real-world systems.

ISO 26262規格は、2011年に導入されて以来、自動車の電気・電子システムの機能安全性を実現するための最先端の方法論を提供してきた。他の要求事項の中でも、定量的な故障解析技術を用いて、ハードウェア故障の確率的指標(PMHF)のような定量的な指標を推定することが求められている。この規格では、いくつかの簡単なガイダンスを提供しているが、PMHF を詳細に計算する完全な方法論は、文献に十分に記載されていない。この論文では、Fault Tree Analysis(FTA)を使用してハードウェア故障の確率的メトリックを計算するためのいくつかの重要なフレームワークを紹介する。解析の最上位レベルでは、複雑な多機能システム内の潜在的な故障を整理するために、これまでの文献から導き出された手法を使用することができる。FTA の下位レベルでは、デュアルポイントの潜在故障と検出された故障を含むすべての故障カテゴリの影響を、適切な診断カバレッジとプルーフテスト間隔時間を使用して説明することができる。本論文では、この方法を実証するために、全体を通して簡単な例を示している。PMHFの上限値を推定するために、いくつかの単純化を提案した。また、採用されたステップと手法、及び実用的な実世界のシステムにおけるPMHF計算の性質に関連した結論が示されている。

このアブストラクトに書かれているように、ISO 26262 Part 10ではPMHF式の結果しか書かれておらず、導出過程が書かれていません。さらに初版にはあった定量FTAによるPMHFの計算方法が、なぜか第2版では削除されています。従って、定量FTAによる正確なPMHF計算フレームワークは業界で必要とされており、それが今回弊社からRAMS 2021に投稿した論文です。これは現時点では非公開であるため、来年1月のRAMS 2021での発表以降に公開する予定です。

【追記】RAMS 2021において、A Framework for Performing Quantitative Fault Tree Analyses for Subsystems with Periodic Repairsとして発表済みです。


$\dagger$N. Das and W. Taylor, "Quantified fault tree techniques for calculating hardware fault metrics according to ISO 26262," 2016 IEEE Symposium on Product Compliance Engineering (ISPCE), Anaheim, CA, 2016, pp. 1-8, doi: 10.1109/ISPCE.2016.7492848.


左矢前のブログ 次のブログ右矢

PMHF論文sae2020 (4)

posted by sakurai on August 15, 2020 #293

イントロダクション

論文sae2020$\dagger$のイントロダクションです。

まずISO 26262の概要を述べています。

ISO 26262 is an international standard for functional safety of electrical and/or electronic systems in production automobiles.

ISO 26262 は、生産用自動車の電気・電子システムの機能安全性に関する国際規格である。

The standard applies to all activities during the lifecycle of safety-related systems comprised of electrical, electronic, and software components.

この規格は、電気・電子・ソフトウェアコンポーネントで構成される安全関連システムのライフサイクルにおけるすべての活動に適用される。

The 2011 version of the standard [1] consists of 10 parts covering various aspects of the system's design and development at the system, software, hardware, production and operation and the new 2018 version of the standard [2] has 12 parts, adding applications to semi-conductors and motorcycles to the mix.

2011年版の規格[1]は、システム、ソフトウェア、ハードウェア、生産、運用におけるシステム設計と開発の様々な側面をカバーする10のパートで構成されており、2018年版の新規格[2]は12のパートで構成されており、オートモビリティへの適用が追加されている。半導体とオートバイを合わせたものである。

次に、ランダムハードウェア故障について、規格での位置づけを述べています。

ISO 26262 requires that the impacts of random hardware faults on hardware to be analyzed and the risk of safety-critical failures due to such faults is shown to be below a certain threshold.

ISO 26262では、ハードウェアのランダムな故障がハードウェアに与える影響を分析し、そのような故障による安全上の重大な故障のリスクが一定の閾値以下であることを示すことを要求している。

The document defines the ASIL (Automotive Safety and Integrity Level) classifications and sets the particular ASIL safety goals designated A through D, with D being the most stringent.

この文書では、ASIL (Automotive Safety and Integrity Level) の分類を定義し、AからDまでのASILの安全目標を設定している。

For most hardware design and validation engineers, this requirement exposed them to a new paradigm with unaccustomed procedures and terminology such as ASIL, PMHF (Probabilistic Metric for Random Hardware Failures), and others.

ほとんどのハードウェア設計および検証エンジニアにとって、この要件は、ASIL、PMHF(ランダムハードウェア障害のための確率的メトリック)などのような、慣れない手順や用語を使用した新しいパラダイムに触れることになった。

この論文の目的を述べています。

The goal of this paper is to explain some of the terminology and the engineering approaches of ISO 26262 and make them more compatible with the terminology and methods used by design and reliability professionals involved in calculating PMHF to assess the ASIL levels of safety-critical systems.

この論文の目的は、ISO 26262の用語とエンジニアリングアプローチの一部を説明し、安全クリティカルシステムのASILレベルを評価するためにPMHFを計算する際に設計・信頼性の専門家が使用する用語と方法との互換性を高めることである。

イントロダクションは特に問題ありません。


$\dagger$: Kleyner, A. and Knoell, R., “Calculating Probability Metric for Random Hardware Failures (PMHF) in the New Version of ISO 26262 Functional Safety - Methodology and Case Studies,” SAE Technical Paper 2018-01-0793, 2018


左矢前のブログ 次のブログ右矢

PMHF論文sae2020 (3)

posted by sakurai on August 14, 2020 #292

アブストラクト(続き)

論文sae2020$\dagger$のアブストラクトの続きです。

In order to clarify how PMHF is calculated within the content of ISO 26262, this paper will discuss how to calculate both the failure rate and the average probability of failure per hour in terms of definitions, sources of the data, applications, and advantages and disadvantages.

本稿では、ISO 26262 の内容の中で PMHF がどのように計算されるのかを明確にするために、定義、データの出所、アプリケーション、メリットとデメリットの観点から、故障率と時間当たりの平均故障確率の計算方法を議論する。

PMHFの定義や前提、導出過程を説明した文献は、弊社のブログや論文以外に全く無いため、非常に興味深い部分で本文を読むのが楽しみです。

It will also present examples of calculating PMHF including the average probability of failure per hour for a non-exponentially distributed failure population as well as an example of a system with redundancy.

また、指数関数的に分布していない故障集団の1時間当たりの平均故障確率を含むPMHFの計算例と、冗長性を持つシステムの例を紹介する。

弊社は、ISO 26262の精神の基礎は以下の2つに置かれていると考えます。

  • 故障率は一定=故障率はバスタブカーブの偶発故障期間
  • 定期検査・修理による故障からの復旧(リニューアル)

従って、非指数分布の故障を考えることはISO 26262を逸脱するものであり、不要だと考えます。単純な指数分布でさえ、項目2が十分考慮されていない現状を鑑みると、まず上記2項目をきちんと理解することが先だと考えます。


$\dagger$: Kleyner, A. and Knoell, R., “Calculating Probability Metric for Random Hardware Failures (PMHF) in the New Version of ISO 26262 Functional Safety - Methodology and Case Studies,” SAE Technical Paper 2018-01-0793, 2018


左矢前のブログ 次のブログ右矢


ページ: