Posts Tagged with "PMHF"

既に発行済みのブログであっても適宜修正・追加することがあります。
We may make changes and additions to blogs already published.
posted by sakurai on September 4, 2020 #309

第2版でのPMHF式の改訂

ISO 26262第2版になり、PMHF式が改訂されました。第1版にはなかったパターン3,4が加わった理由は、例えば冗長システムのように、IFのフォールトがレイテントになる場合を考慮したものだと認識していました。このたび「ISO 26262第2版解説書」(日本規格協会)を購入し、その背景等の情報が掲載されていたため、検討します。

さて、上記解説書によれば、パターン3, 4が加わった理由は、「フォールトトレラントが要求されるアイテムの場合では、それ以外の順序、状況も想定できる」とあります。それ、というのは第1版の前提の意味であり、「安全機構、意図した機能の順でフォールトが発生する場合」とあります。すなわち、それ以外というのは、意図機能(IF)、安全機構(SM)の順番でフォールトが発生する場合であり、IFのフォールトがレイテントとなる場合に他なりません。これは弊社論文で2017年に指摘していたとおり、初版のPMHF式は冗長システムに対応していなかったことを裏書きします。

解説書には、今まで謎だったPMHF式の導出過程が載っていたので、それを解析します。

パターン1

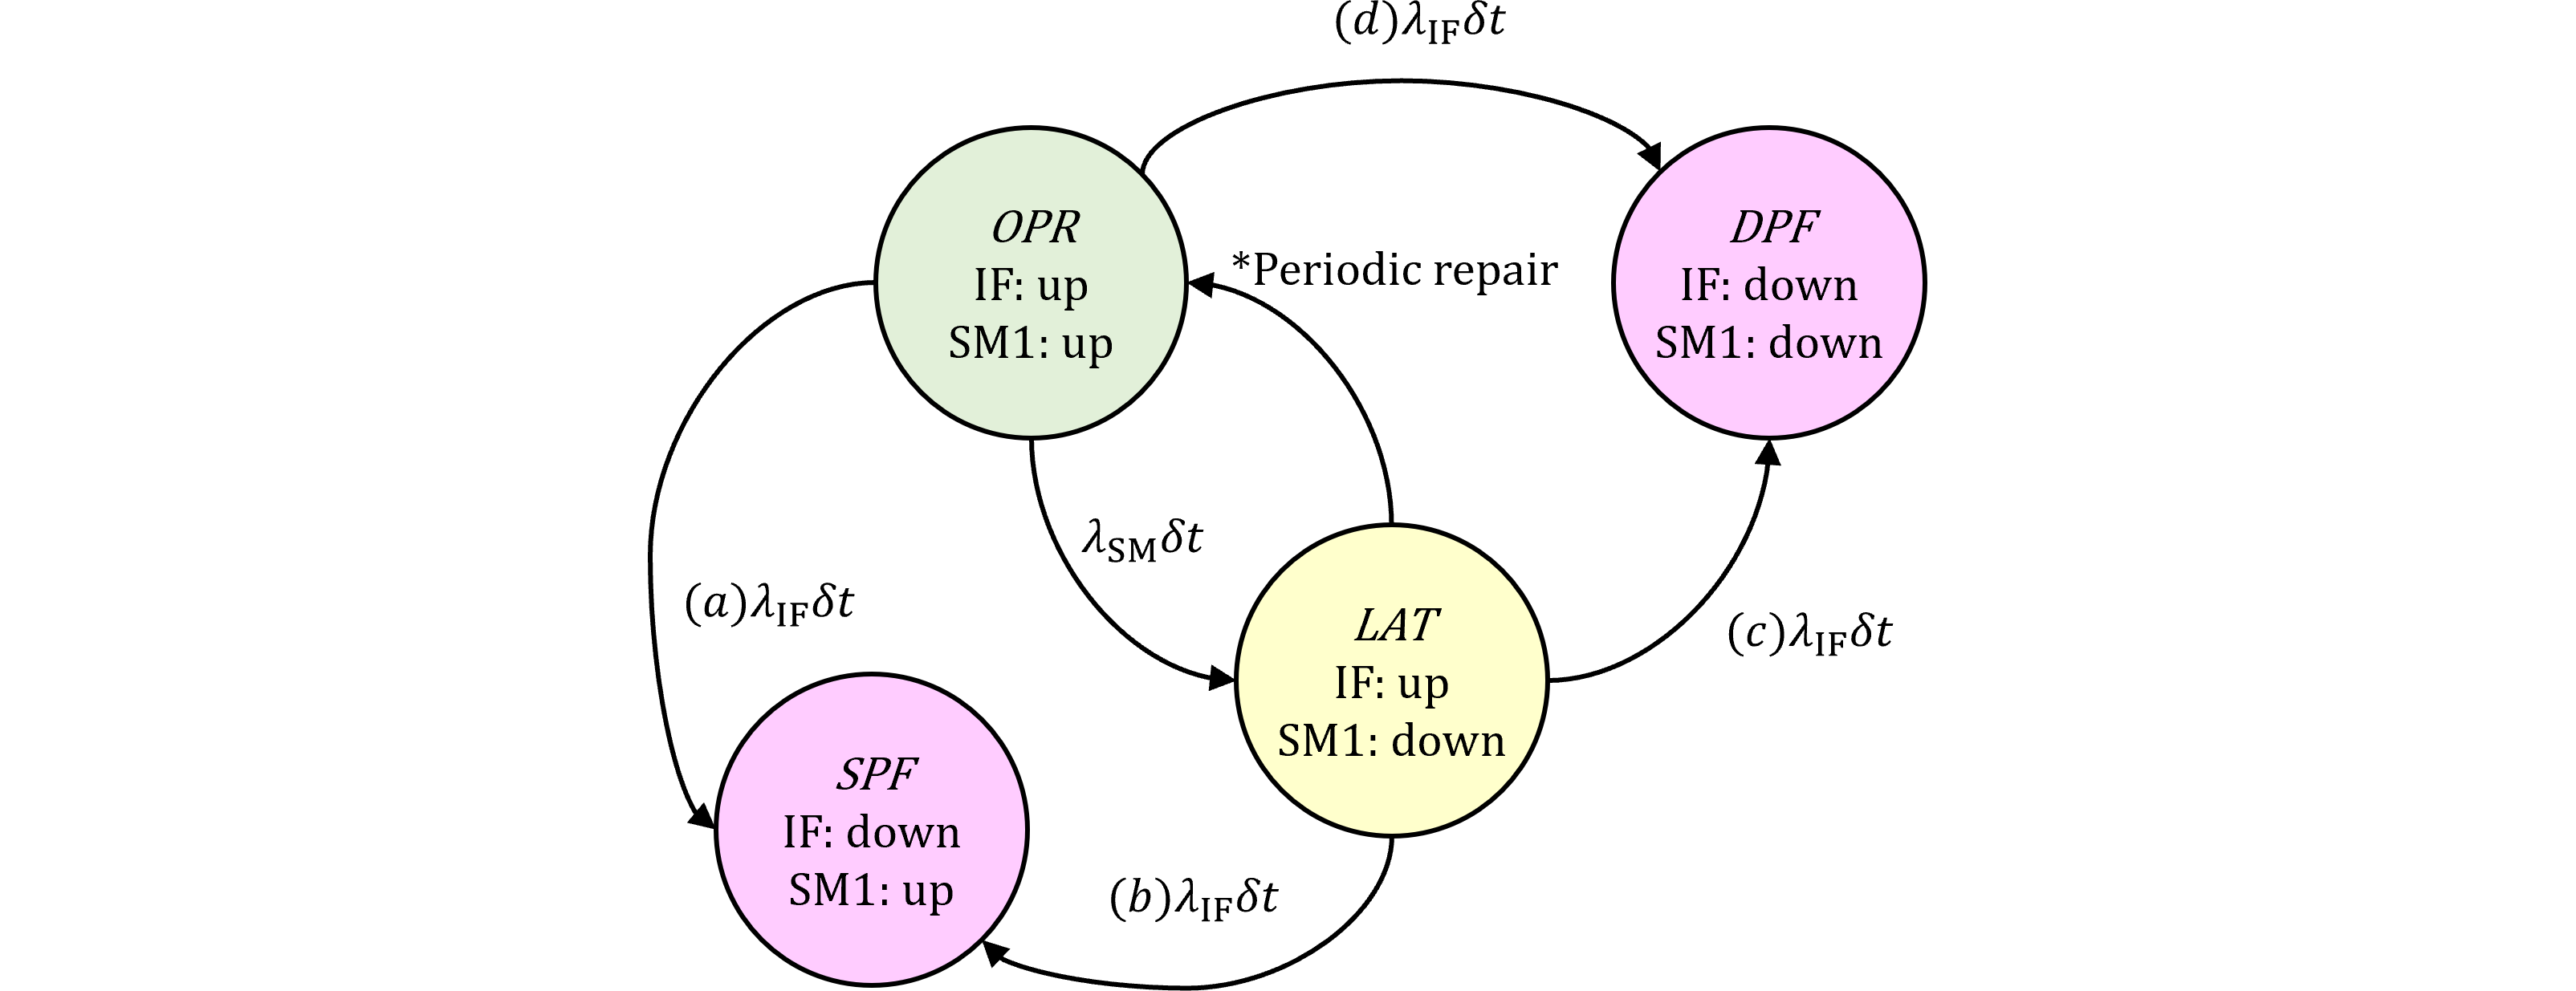
図309.1は、第1版にも存在した、パターン1=「安全機構、意図した機能の順でフォールトが発生する場合で安全機構のフォールトが検出されない場合」です。

図%%.1
図309.1 パターン1

パターン1の導出過程を、記法を弊社と合わせたものを示します。弊社では先に$T_\text{lifetime}$で割るため、 $$ \frac{1}{T_\text{lifetime}}F_\mathrm{DPF,SM_\text{latent}\rightarrow IF}=\frac{1}{T_\text{lifetime}}\int_0^{T_\text{lifetime}}\left((1-K_\text{SM,MPF})f_\text{SM}(t)\\ \cdot\int_t^{T_\text{lifetime}}K_\text{IF,DPF}f_\text{IF}(t')dt'\cdot R_\text{IF}(t)\right)dt \tag{309.1} $$ そもそもこの式の成立に問題がありそうですが、それはさておき、式変形を辿ってみます。まず、(309.1)においてIFに関する演算を先に実行すれば、 $$ \require{cancel} \int_t^{T_\text{lifetime}}K_\text{IF,DPF}f_\text{IF}(t')dt'\cdot R_\text{IF}(t)\\ =K_\text{IF,DPF}\left(F_\text{IF}(T_\text{lifetime})-F_\text{IF}(t)\right) R_\text{IF}(t)\\ =K_\text{IF,DPF}\left((\bcancel{1}-e^{-\lambda_\text{IF}T_\text{lifetime}})-(\bcancel{1}-e^{-\lambda_\text{IF}t})\right)e^{-\lambda_\text{IF}t}\\ \approx\lambda_\text{IF,DPF}(T_\text{lifetime}-t)(1-\lambda_\text{IF}t) \tag{309.2} $$ (309.2)を(309.1)に代入して、 $$ \frac{1}{T_\text{lifetime}}F_\mathrm{DPF,SM_\text{latent}\rightarrow IF}\\ =\frac{1}{T_\text{lifetime}}(1-K_\text{SM,MPF})\int_0^{T_\text{lifetime}}f_\text{SM}(t)\lambda_\text{IF,DPF}(T_\text{lifetime}-t)(1-\lambda_\text{IF}t)dt \tag{309.3} $$ これと図309.1の2行目を比較すると、なぜか、 $$ \int_0^{T_\text{lifetime}}\color{red}{f_\text{SM}(t)}dt=\int_0^{T_\text{lifetime}}\color{red}{\lambda_\text{SM}}dt $$ と式変形しているようです(疑問1)。左辺の$f_\text{SM}(t)$に$R_\text{SM}(t)$をかければこうなりますが、$R_\text{SM}(t)$は式中に存在しないので、単純な計算ミスでしょうか?そうでなく、無理やり$R_\text{SM}(t)\approx1$を用いたと考えても、一方で$R_\text{IF}(t)$を計算しているのは片手落ちです。

【追記】 このようなことかもしれません。 $$ \int_0^{T_\text{lifetime}}f(t)dt=\left[F(t)\right]^{T_\text{lifetime}}_0=F(T_\text{lifetime})-F(0)=F(T_\text{lifetime})\\ =1-e^{-\lambda T_\text{lifetime}}\approx\lambda T_\text{lifetime}=\int_0^{T_\text{lifetime}}\lambda dt=\lambda\int_0^{T_\text{lifetime}}dt $$ $f(t)$の積分は$\lambda$として外に出せるという公式となります。上式の$R_\text{IF}(t)$にしても、式変形途中では$1-\lambda_\text{IF}t$としていますが、最終的に$R_\text{IF}(t)\approx1$としています。

なお、本稿はRAMS 2024に投稿予定のため一部を秘匿していますが、論文公開後の2024年2月頃に開示予定です。


左矢前のブログ 次のブログ右矢

posted by sakurai on September 3, 2020 #308

FTA

A. 定量的な FTA の適用可能性と使用の制限

PMHF論文das2016$\dagger$の続きです。

以下の段落では一般論を述べています。

Quantitative methodologies are a useful tool in safety assurance processes, where the objective is to reduce risk to a quantifiably acceptable level by estimating the rates of occurrence of hazardous events. Standards such as IEC 61508 are based strongly on this principle. Given such an estimate of the probability of safety-related hazards, the risk can in principle be mitigated to an acceptably low level.

定量的方法論は、危険事象の発生率を推定することにより、リスクを定量的に許容できるレベルまで低減することを目的とした安全保証プロセスにおいて有用なツールである。IEC 61508 などの規格は、この原則に強く基づいている。安全に関連するハザードの発生確率をこのように推定すれば、原則としてリスクは許容可能な低レベルにまで軽減することができる。

以下の段落ではシステマティックフォールトを混ぜて議論していますが、混ぜるとわけがわからなくなります。対処する手法が異なるからです。ここではランダムハードウェア故障に絞って議論したほうが良いでしょう。  

However, there are several critical limitations to such methods that must be recognized. While random failures in electronic hardware may be modeled with probabilistic methods, systematic failures (for example in deterministic software) cannot be modeled in this way. This may lead the analyst to under-represent or overlook important systematic failures [8]. There is wide variability in underlying data available for the reliability failure of electronic components, which in turn leads to calculations with a relatively wide range of uncertainty. There is also evidence of a tendency for the analyst to believe in the independence of events which are represented independently in the FTA, while objective observation would find a correlation between events [9]. ISO 26262 takes steps to mitigate these limitations, for example by recognizing the primacy of process adherence in preventing and avoiding systematic faults, which are not generally quantifiable by probabilistic methods. It is important to remember that analyst judgment is a critical factor in the success of a quantified FTA. The analysis is neither a formal proof nor a validation of safety, but merely a structured record of the analyst's best understanding.

しかし、このような方法には、認識しなければならないいくつかの重大な限界がある。電子ハードウェアのランダムな故障は確率論的手法でモデル化することがでるが、系統的な故障(例えば決定論的ソフトウェア)はこの方法ではモデル化できません。このため、解析者は重要なシステマティックな故障を過小評価したり、見落としたりする可能性がありる[8]。電子部品の信頼性故障について利用可能な基礎データには大きなばらつきがあり、その結果、比較的広い範囲の不確実性を伴う計算が行われることになる。また、客観的な観察ではイベント間の相関関係を見つけることができるのに対し、分析者は、FTA で独立して表現されているイベントの独立性を信じる傾向があるという証拠もある[9]。ISO 26262 は、確率論的手法では一般的に定量化できないシステマティックな欠陥の予防と回避において、プロセスの堅持が重要であることを認識するなど、これらの制限を緩和するための措置を講じている。分析者の判断が定量化された FTA を成功させるための重要な要素であることを覚えておくことが重要である。解析は、安全性の正式な証明でも検証でもなく、解析者の最善の理解を構造化した記録に過ぎない。


$\dagger$N. Das and W. Taylor, "Quantified fault tree techniques for calculating hardware fault metrics according to ISO 26262," 2016 IEEE Symposium on Product Compliance Engineering (ISPCE), Anaheim, CA, 2016, pp. 1-8, doi: 10.1109/ISPCE.2016.7492848.


左矢前のブログ 次のブログ右矢

posted by sakurai on September 2, 2020 #307

FTA

PMHF論文das2016$\dagger$の続きです。

FTAの説明と、それによるPMHFの導出の概略を述べています。

FTA is a logical combination of intermediate events and basic events, which can be assembled using AND and OR logical operators to analyze the effects of component faults on system failures. In a safety analysis, the FTA typically begins with a top-level event representing a major hazardous event, and/or the violation of a safety goal or Functional Safety Requirement, as defined in ISO 26262. The analysis is then performed by deducing what conditions or events would lead to the top-level event, and in what logical combination. The method has been in use in industrial settings for several decades (see for example [3], [4], [5]). More recently, the method has been applied to automotive systems [6], [7] and suggested for wider use as an analysis framework. In some cases, the FTA may be qualitative in nature. If probabilities of the underlying lower-level events can be estimated, then an estimate of the probability can be made for the top-level event. The PMHF is just such a quantitative estimation.

FTA は、中間イベントと基本イベントを論理的に組み合わせたもので、AND と OR 論理演算子を使って組み立てることで、コンポーネントの故障がシステムの故障に与える影響を分析することができる。安全解析では、FTAは通常、主要な危険イベントや、ISO 26262で定義されている安全目標や機能安全要件の違反を表すトップレベルのイベントから始まる。次に、どのような条件や事象がトップレベルの事象につながるのか、どのような論理的な組み合わせで行われるのかを推論することで分析が行われる。この手法は、数十年前から産業界で使用されている (例えば [3], [4], [5] を参照)。最近では、この手法が自動車システムに適用され [6], [7]、解析フレームワークとしての幅広い利用が提案されています。いくつかのケースでは、FTA は定性的な性質を持っています。もし、基礎となる下位レベルのイベントの確率が推定できれば、上位レベルのイベントの確率を推定することができます。PMHF はまさにそのような定量的な推定である。

本論文は、初版の規格を別にすればPMHF式とFTAを結び付けた初めての論文で、重要論文です。しかしながら1st editionの範囲に留まっています。1st editionの範囲とは、IFがアンリペアラブルという意味です。従って、冗長サブシステムには用いることができません。


$\dagger$N. Das and W. Taylor, "Quantified fault tree techniques for calculating hardware fault metrics according to ISO 26262," 2016 IEEE Symposium on Product Compliance Engineering (ISPCE), Anaheim, CA, 2016, pp. 1-8, doi: 10.1109/ISPCE.2016.7492848.


左矢前のブログ 次のブログ右矢

posted by sakurai on September 1, 2020 #306

イントロダクション

PMHF論文das2016$\dagger$の続きです。

FTAの説明とフレームワークの必要性を述べています。

Fault Tree Analysis (FTA) is a method often proposed for calculation of the PMHF in real-world systems. However, FTA is a very general method, subject to a wide range of interpretations and techniques depending on the objectives of a given problem, the type of failures & faults being considered, and the terminology employed by various industries. There is not yet an accurate and well-explained practical guide to the specific techniques appropriate for PMHF calculation in the automotive industry. For example, large and complex systems, such as those that comprise real-world automotive products, are often difficult to capture in an FTA in a systematic and repeatable way. The use of diagnostic coverage (D.C.) (e.g., by an imperfect safety mechanism which may detect some but not all element faults) is often utilized in hardware metric calculations. However, D.C. concepts are not widely clarified in the industry literature, leaving a gap in understanding for many FTA practitioners. At lower levels of the FTA, specific frameworks for calculating the effect of single-point and dual-point faults (including dual-point latent faults) are necessary to obtain a correct PMHF estimation. All these topics will be addressed here along with a worked automotive example.

フォールトツリー解析(FTA)は、実世界のシステムにおけるPMHFの計算のためにしばしば提案される手法です。しかし、FTAは非常に一般的な手法であり、与えられた問題の目的、考慮される故障や故障の種類、そして様々な業界で採用されている用語に応じて、幅広い解釈や技術の対象となっています。自動車産業におけるPMHF計算に適した特定の技術については、正確かつ十分に説明された実用的なガイドはまだ存在しません。例えば、実際の自動車製品を構成するような大規模で複雑なシステムは、体系的で再現性のある方法でFTAに取り込むことが困難な場合が多い。診断カバレッジ(D.C.)(例えば、一部の要素の故障は検出できるが、すべての要素の故障は検出できない不完全な安全機構)の使用は、しばしばハードウェアメトリックの計算に利用されます。しかし、D.C.の概念は業界の文献では広く明確にされておらず、多くのFTA実務者にとっては理解にギャップがあります。FTA の低レベルでは、正しい PMHF 推定を得るためには、単点および二点故障(二点潜伏故障を含む)の影響を計算するための特定のフレームワークが必要となります。ここでは、これらすべてのトピックについて、実際の自動車の例を挙げながら解説します。


$\dagger$N. Das and W. Taylor, "Quantified fault tree techniques for calculating hardware fault metrics according to ISO 26262," 2016 IEEE Symposium on Product Compliance Engineering (ISPCE), Anaheim, CA, 2016, pp. 1-8, doi: 10.1109/ISPCE.2016.7492848.


左矢前のブログ 次のブログ右矢

PMHF論文das2016 (2)

posted by sakurai on August 31, 2020 #305

イントロダクション

PMHF論文das2016$\dagger$の続きです。

以下の段落はISO 26262の概要です。

The international standard ISO 26262 “Road vehicles - Functional safety” has been released in final form since late 2011 [1]. It provides a standardized set of processes and methods to assure the functional safety of electrical and electronic systems in the automotive domain. The standard is an evolution of the IEC 61508 functional safety standard, applied specifically to the automotive realm [2].

国際規格ISO 26262「道路運送車両-機能安全」は、2011年後半から最終版としてリリースされている[1]。この規格は、自動車分野における電気・電子システムの機能安全を保証するためのプロセスと手法を標準化したものである。この規格は、IEC 61508の機能安全規格を発展させたもので、特に自動車分野に適用されている[2]。

以下の段落はISO 26262の説明です。

ISO 26262 requires a variety of processes and frameworks for safety management, safety concept development, requirements flow-down, and verification & validation activities. The standard also requires quantified metrics to be calculated for safety-related systems.

ISO 26262 は、安全管理、安全コンセプト開発、要求事項のフローダウン、検証・検証活動のためのさまざまなプロセスやフレームワークを要求している。また、安全関連システムの定量化されたメトリクスの計算も要求している。

以下の段落はPMHFの説明です。

Of particular interest is the Probabilistic Metric for Hardware Failure (or PMHF), which represents a calculated estimate of the rate of hazard occurrence due to random hardware failures. This value must be calculated for systems rated at a high Automotive Safety Integrity Level (or ASIL2). Specifically, systems rated at ASIL C or ASIL D must achieve targets such as those proposed by the standard and listed in Table 1.

特に関心が高いのは、ハードウェア故障の確率的指標(PMHF)であり、これは、ランダムなハードウェア故障によるハザード発生率の計算された推定値を表している。 この値は、高いAutomotive Safety Integrity Level(またはASIL2)で評価されたシステムのために計算されなければならない。具体的には、ASIL C または ASIL D に格付けされたシステムは、規格で提案され、表 1 に記載されているような目標を達成しなければならない。


$\dagger$N. Das and W. Taylor, "Quantified fault tree techniques for calculating hardware fault metrics according to ISO 26262," 2016 IEEE Symposium on Product Compliance Engineering (ISPCE), Anaheim, CA, 2016, pp. 1-8, doi: 10.1109/ISPCE.2016.7492848.


左矢前のブログ 次のブログ右矢

PMHF論文das2016

posted by sakurai on August 28, 2020 #304

次にPMHF論文das2016$\dagger$です。この論文は弊社の論文を除き、例外的に1st edition Part10に掲載されているPMHF式に準拠しているものです。それだけでなく、FTAによりPMHF式をどのように実装するかが述べられている実践的なものです。残念ながら、2nd edition発行前の論文であるため、1st editionの範囲でしかなく、冗長サブシステムに対応する形式にはなっていません。

アブストラクト

早速アブストラクトを見てみます。

Since its introduction in 2011, the ISO 26262 standard has provided state-of-the-art methodology for achieving the functional safety of automotive electrical and electronic systems. Among other requirements, the standard requires estimation of quantified metrics such as the Probabilistic Metric for Hardware Failure (PMHF) using quantitative failure analysis techniques. While the standard provides some brief guidance, a complete methodology to calculate the PMHF in detail has not been well described in the literature. This paper will draw out several key frameworks for successfully calculating the probabilistic metric for hardware failure using Fault Tree Analysis (FTA). At the top levels of the analysis, methods drawn from previous literature can be used to organize potential failures within a complex multifunctional system. At the lower levels of the FTA, the effects of all fault categories, including dual-point latent and detected faults, can be accounted for using appropriate diagnostic coverage and proof- test interval times. A simple example is developed throughout the paper to demonstrate the methods. Some simplifications are proposed to estimate an upper bound on the PMHF. Conclusions are drawn related to the steps and methods employed, and the nature of PMHF calculation in practical real-world systems.

ISO 26262規格は、2011年に導入されて以来、自動車の電気・電子システムの機能安全性を実現するための最先端の方法論を提供してきた。他の要求事項の中でも、定量的な故障解析技術を用いて、ハードウェア故障の確率的指標(PMHF)のような定量的な指標を推定することが求められている。この規格では、いくつかの簡単なガイダンスを提供しているが、PMHF を詳細に計算する完全な方法論は、文献に十分に記載されていない。この論文では、Fault Tree Analysis(FTA)を使用してハードウェア故障の確率的メトリックを計算するためのいくつかの重要なフレームワークを紹介する。解析の最上位レベルでは、複雑な多機能システム内の潜在的な故障を整理するために、これまでの文献から導き出された手法を使用することができる。FTA の下位レベルでは、デュアルポイントの潜在故障と検出された故障を含むすべての故障カテゴリの影響を、適切な診断カバレッジとプルーフテスト間隔時間を使用して説明することができる。本論文では、この方法を実証するために、全体を通して簡単な例を示している。PMHFの上限値を推定するために、いくつかの単純化を提案した。また、採用されたステップと手法、及び実用的な実世界のシステムにおけるPMHF計算の性質に関連した結論が示されている。

このアブストラクトに書かれているように、ISO 26262 Part 10ではPMHF式の結果しか書かれておらず、導出過程が書かれていません。さらに初版にはあった定量FTAによるPMHFの計算方法が、なぜか第2版では削除されています。従って、定量FTAによる正確なPMHF計算フレームワークは業界で必要とされており、それが今回弊社からRAMS 2021に投稿した論文です。これは現時点では非公開であるため、来年1月のRAMS 2021での発表以降に公開する予定です。

【追記】RAMS 2021において、A Framework for Performing Quantitative Fault Tree Analyses for Subsystems with Periodic Repairsとして発表済みです。


$\dagger$N. Das and W. Taylor, "Quantified fault tree techniques for calculating hardware fault metrics according to ISO 26262," 2016 IEEE Symposium on Product Compliance Engineering (ISPCE), Anaheim, CA, 2016, pp. 1-8, doi: 10.1109/ISPCE.2016.7492848.


左矢前のブログ 次のブログ右矢

PMHF論文sae2020 (8)

posted by sakurai on August 19, 2020 #297

PMHFと基本的な信頼性計算(続き)

論文sae2020$\dagger$のPMHFと基本的な信頼性計算(続き)です。

ISO 26262-2018 designates the average probability of failure per hour over the operational lifetime as the probability that the item will fail before its lifetime $T_\text{Lifetime}$ as $Prob(t ≤ T_\text{Lifetime})/T_\text{Lifetime}$. In order to simplify the notations and improve the understanding, in this paper we will designate the average probability of failure per hour (assuming these faults are independent) as $P_{avg/t}$ and express it as a product of probabilities of failures required for a system to fail over the time of operation:

ISO 26262-2018 では、運用寿命における 1 時間当たりの平均故障確率を、その品目がその寿命$T_\text{Lifetime}$までに故障する確率を$Prob(t ≤ T_\text{Lifetime})/T_\text{Lifetime}$として指定している。表記を簡略化して理解を深めるために、本稿では、1時間あたりの平均故障確率を(以下のように仮定して)指定することにする。 これらの故障は独立している)を$P_{avg/t}$とし、システムが運転中に故障するのに必要な故障確率の積として表現します。

ISO 26262-2018がPMHFを $$\frac{\Pr(t ≤ T_\text{Lifetime})}{T_\text{Lifetime}}$$ のように規定していると書かれているが、これは正しくありません。

たしかに、ISO 26262:2018ではPart10 8.4において、PMHFを次のように書いています。

The following shows the derivation of the average probability of failure per hour over the operational lifetime of the item regarding single point faults.
(略)
Then, average probability of failure per hour (according to ISO 26262-5), over operational life time (Tlifetime) is:
$$\frac{\Pr(t ≤ T_\text{Lifetime})}{T_\text{Lifetime}}$$

つまり、SPFについての式であると限定しています。SPFにおいてはフォールトの発生により直ちにVSGとなるため、修理の時間が全く取れないので、分子はReliabilityで良いのですが、本来は、Reliabilityに加えて修理を考慮したAvailabilityでなければなりません。

確率式で書き直すと、SPFに限れば、PMHFは $$M_\text{PMHF,SPF}=\frac{\Pr(\text{item fail till }T_\text{Lifetime})}{T_\text{Lifetime}}$$ で良いですが、一般には $$M_\text{PMHF}=\frac{\Pr(\text{item down at }T_\text{Lifetime})}{T_\text{Lifetime}}$$ とするべきです。本論文に限らず、多数の論文がPMHF結果式を無視していますが、PMHF結果式を適用すべきです。

この論文の次の段落からは、ISO 26262の精神のひとつである指数分布をワイブル分布に一般化しており、ISO 26262を逸脱するため、検討はここまでとします。

結論として、PMHF式についての信頼性工学的な議論を期待していたのですが、SPFのみに通用する話を一般化した上、ISO 26262非互換な議論に脱線しており、期待はずれに終わりました。


$\dagger$: Kleyner, A. and Knoell, R., “Calculating Probability Metric for Random Hardware Failures (PMHF) in the New Version of ISO 26262 Functional Safety - Methodology and Case Studies,” SAE Technical Paper 2018-01-0793, 2018


左矢前のブログ 次のブログ右矢

PMHF論文sae2020 (7)

posted by sakurai on August 18, 2020 #296

PMHFと基本的な信頼性計算(続き)

論文sae2020$\dagger$のPMHFと基本的な信頼性計算(続き)です。

The assumption of a constant failure rate, though often debated by reliability professionals, provides simplified and expedient closed-form calculations which have been utilized to assess the ASIL safety goals throughout the ISO 26262. Table 1 provides the PMHF values expressed as failure rates in units of FIT (Failures In Time) defined as 10^9 times the number of failures divided by the product of the number of components and their operating hours before failure. A convenient metric is 1 FIT = 1 PPM per 1000 hours of operation corresponding to each ASIL safety goal.

一定の故障率の仮定は、信頼性の専門家によってしばしば議論されているが、簡略化された簡便なクローズドフォーム計算を提供し、ISO 26262 の ASIL 安全目標を評価するために利用されている。表1は故障率を、$10^9$倍した故障回数を部品点数と故障前の稼働時間の積で除した値のFIT (Failures In Time)の単位で表したPMHF値を示している。便利な指標は、各ASILの安全目標に対応する運転時間1000時間あたりの1FIT=1PPMである。

1000時間につき1PPM(=$10^{-6}$)とは、誤りではありませんが、中途半端な例示です。PPMを持ち出すなら1時間に1PPB(=$10^{-9}$)とするか、1回/$10^9$時間とするかいずれかでしょう。

Determining the probability of a fault causing a safety-critical failure ISO 26262 Part 5 requires that they are analyzed and classified into six different categories: (a) Safe, (b) Single point, (c) Residual, (d) Detected multi-point, (e) Perceived multi-point and (f) Latent multi-point. Residual is the portion of the fault which is not controlled by a safety mechanism. Latent faults are not detected by safety mechanisms or perceived by the driver. Perceived faults may be detected indirectly through deviating behavior on the vehicle level. Multiple- point faults result in several hardware faults whereas single-point fault requires just one. More detailed explanations of these fault categories and the guidance of calculating PMHF for these types of faults are provided by the ISO 26262 Parts 1 and 5. However, in this paper, we will focus on the two major types of failures: single-point and multi-point faults.

ISO 26262 Part 5では、安全上重要な故障の原因となる故障の確率を決定するために、故障を分析し、6つの異なるカテゴリーに分類することを要求している。(a) 安全、(b) 単一点、(c) 残留、(d) 検出された多点、(e) 知覚された多点、(f) 潜在的多点である。残留は,安全機構によって制御されていない故障の部分である。潜在的な欠陥は、安全機構によって検出されず、運転者によって感知されない。知覚されたフォルトは、車両レベルでの逸脱した動作によって間接的に検出されることがある。多点フォルトは複数のハードウェアフォルトを発生させるのに対し、シングルポイントフォルトは1つのハードウェアフォルトを必要とします。これらの故障カテゴリの詳細な説明や、これらのタイプの故障に対する PMHF の計算方法については、ISO 26262 第 1 部と第 5 部に記載されている。しかし、本稿では、単一点故障と多点故障という 2 つの主要なタイプの故障に焦点を当てる。

多点フォルトが複数のハードウェアフォルトを必要とするという事実と、レイテントフォルトの説明が別に書かれているため、著者は理解しているのかどうかが不明です。レイテントフォルトは1点フォルトであるにも関わらず、マルチポイントフォルトと名付けられているからです。上記の説明ではその説明が無いため、レイテントフォルトがが複数のハードウェアフォルトを発生するともとられかねません。

However, dealing with multi-points faults is more challenging. In reliability engineer’s terminology, this would be similar to modeling (although with some subtle differences) a parallel system. The failure rate of such a system would no longer be constant, but rather a function of time which makes it more difficult to express PMHF in terms of failure rates. For that purpose, the new version of the ISO 26262 standard introduces a new metric, Average Probability of Failure per Hour for the Lifetime. It is important to note that this metric is not commonly used by the reliability and design professionals and, therefore, will require some further explanation.

しかし、多点故障への対応はより困難です。信頼性エンジニアの用語で言えば、これは並列システムのモデリングに似ています(微妙な違いはありますが)。このようなシステムの故障率はもはや一定ではなく、むしろ時間の関数となり、PMHFを故障率で表現することはより困難になる。そのために、ISO 26262の新バージョンでは、新しいメトリック「Average Probability of Failure per Hour for the Lifetime」が導入されている。このメトリックは、信頼性や設計の専門家が一般的に使用しているものではないことに注意が必要であり、そのため、もう少し説明が必要である。

前稿でも説明したとおり、規格の新バージョンで「Average Probability of Failure per Hour for the Lifetime」が導入されたわけではありません。さらに、表現は違いますが、これは信頼性や設計の専門家が一般的に使用しているものです。規格に明確に書かれていないのが原因ですが、Part 10のPMHF式を検証すれば、PFHの定義式と同じことがわかります。

ちなみに、PFHの定義は、ISO 12489で定義されているとおり、不稼働密度を0から車両寿命まで積分して時間平均をとったものです。


$\dagger$: Kleyner, A. and Knoell, R., “Calculating Probability Metric for Random Hardware Failures (PMHF) in the New Version of ISO 26262 Functional Safety - Methodology and Case Studies,” SAE Technical Paper 2018-01-0793, 2018


左矢前のブログ 次のブログ右矢

PMHF論文sae2020 (6)

posted by sakurai on August 17, 2020 #295

ISO 26262とPMHFのコンセプト(続き)

論文sae2020$\dagger$のISO 26262とPMHFのコンセプト(続き)です。

The PMHF and all the related failure rate calculations in a product development team are often handled by a reliability engineer and even though the standard uses the metrics reflecting the probability of failure (or unreliability in reliability engineer’s terms), some of the approaches and metrics used by ISO 26262 are not that of reliability engineering practice. Therefore, the objective of this paper is to explain some of the metrics and calculations suggested by the Functional Safety standard in reliability engineering terms in order to make their application easier.

製品開発チームにおける PMHF や関連するすべての故障率計算は信頼性技術者が担当することが多く、規格では故障の確率(信頼性技術者の用語では不信頼度)を反映したメトリクスを使用しているにもかかわらず、ISO 26262 で使用されているアプローチやメトリクスの中には、信頼性工学の実務とは異なるものもある。そこで、本稿の目的は、機能安全規格で提案されているメトリクスや計算の一部を信頼性工学の用語で説明し、その適用を容易にすることである。

「故障の確率(信頼性技術者の用語では不信頼度)」という表現は、ISO 26262的には誤りです。故障の確率や不信頼度(これらは修理を含まない)ではなく修理を考慮した不稼働度が正しい表現です。次の章で説明しますが、これについてはほとんどの論文が同じ誤りを犯しています。その理由は、規格に数学的な説明が無いためであり、これはPMHF式を自ら導出して初めて理解されることです。

PMHFと基本的な信頼性計算

In order to link the PMHF and reliability terminology, certain basics of reliability calculations need to be briefly covered here which can be found in multiple sources (see, for example, [3]). If the random failures in the field can be modeled by a statistical distribution with the probability density function (pdf) f(t), then the cumulative distribution function (CDF) F(t) representing the probability of failure at the time t or unreliability can be calculated as:

PMHF と信頼性の用語を結びつけるために、信頼性計算のある種の基礎をここで簡単に説明する必要があります。現場でのランダムな故障が確率密度関数(pdf) f(t)を持つ統計分布でモデル化できるならば、時刻 t での故障の確率または信頼性の低下を表す累積分布関数(CDF) F(t)は次のように計算できます。

故障だけを考えれば、PMHFは確率密度関数(PDF)あるいは、その累積分布関数である不信頼度(CDF)により表されるのですが、一方ISO 26262では2nd order SMによる周期的な故障検出と修理を仮定しています。従って、修理を考慮すると、不信頼度$F(t)$は不稼働度$Q(t)$に変更する必要があり、確率密度$f(t)$は不稼働密度(PUD)$q(t)$に変更する必要があります。


$\dagger$: Kleyner, A. and Knoell, R., “Calculating Probability Metric for Random Hardware Failures (PMHF) in the New Version of ISO 26262 Functional Safety - Methodology and Case Studies,” SAE Technical Paper 2018-01-0793, 2018


左矢前のブログ 次のブログ右矢

PMHF論文sae2020 (5)

posted by sakurai on August 16, 2020 #294

ISO 26262とPMHFのコンセプト

論文sae2020$\dagger$のISO 26262とPMHFのコンセプトです。

ISO 26262 Part 5 introduces the concept of PMHF associating it with the failure rate of the safety-critical system or subsystem. A target value for the PMHF for each safety goal is shown in Table 1. The values in the column “Random hardware failure target values” are failure probabilities and derived using the calculation methods described later in this paper.

ISO 26262 第 5 部では、PMHF の概念を、安全上重要なシステムやサブシステムの故障率と関連付けて紹介している。各安全目標に対する PMHF の目標値を表 1 に示す。また、「ランダムハードウェア故障目標値」の欄の値は故障確率であり、後述の計算方法を用いて算出したものである。

この表1のランダムハードウェア故障目標値の欄の値は故障確率というのは誤りです。ランダムハードウェア故障目標値というのはPMHF値であり[1/H]の次元を持つ値です。一方故障確率は無次元の値なので、次元が不整合です。修正するならば、「時間平均した故障確率(time-averaged failure probabilities)」となります。

To verify that the system hardware design meets the defined target values, failure rates are calculated based on the hardware parts involved in the system bill of materials. Failure rates of hardware parts can be estimated based on either one of three sources:
a) hardware part failure rate data from a recognized industry source.
b) statistics based on field returns or tests (with an adequate confidence level),
c) expert judgment founded on an engineering approach based on quantitative and qualitative arguments.

システムハードウェア設計が定義された目標値を満たしていることを確認するために、システム部品表に含まれるハードウェア部品に基づいて故障率を計算します。ハードウェア部品の故障率は、以下の 3 つのソースのいずれかに基づいて推定することができる。
a) 業界で認められた情報源からのハードウェア部品の故障率データ。
b) 現場での返品または試験に基づく統計(十分な信頼度を有する)。
c) 量的および質的な議論に基づく工学的アプローチに基づいて確立された専門家の判断。

PMHFを計算するためには部品故障率が必要ですが、その部品故障率をどこから引用するかについて書かれています。データハンドブック、信頼性試験結果、その他という3通りです。

Therefore, in the calculations, different failure rate sources can be used for different hardware parts of the system. The process of selecting electronic components to meet the ASIL safety goals can be complicated, especially when meeting higher safety goals, like ASIL C or ASIL D. This paper suggests a process flow to select electronic components to meet the required ASIL safety goals including the additional steps when met with challenges to accomplish that. The diagram with explanations is shown in the Appendix of this paper.

したがって、計算では、システムの異なるハードウェア部品に対して異なる故障率ソースを使用することができる。本論文では、要求されたASILの安全目標を満たすために電子部品を選択するプロセスフローを、それを達成するための課題に直面した場合の追加ステップを含めて提案する。解説付きの図は、本稿の付録に示されている。


$\dagger$: Kleyner, A. and Knoell, R., “Calculating Probability Metric for Random Hardware Failures (PMHF) in the New Version of ISO 26262 Functional Safety - Methodology and Case Studies,” SAE Technical Paper 2018-01-0793, 2018


左矢前のブログ 次のブログ右矢


ページ: