|
26 |
新方式によるPUAの導出 (8) |
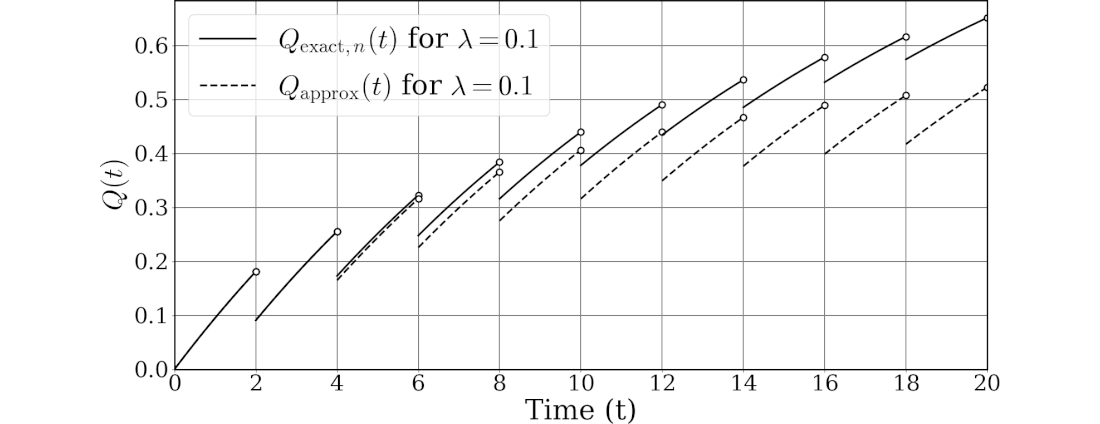
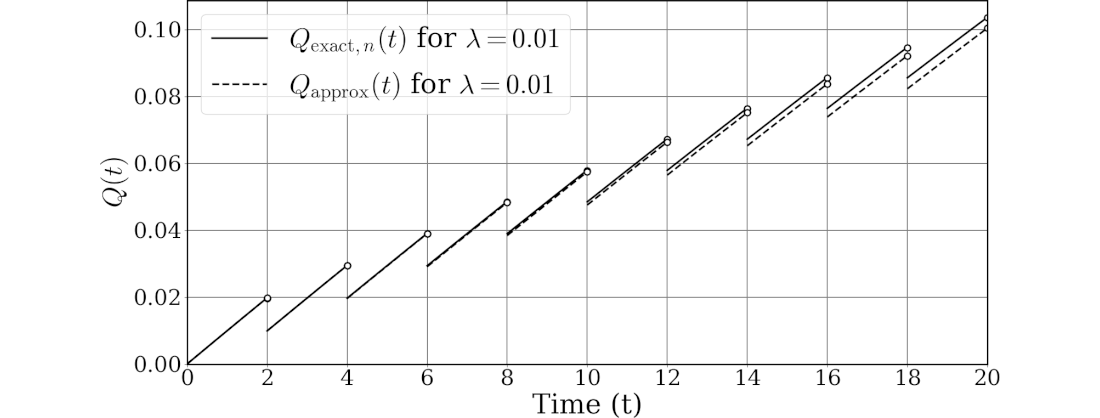
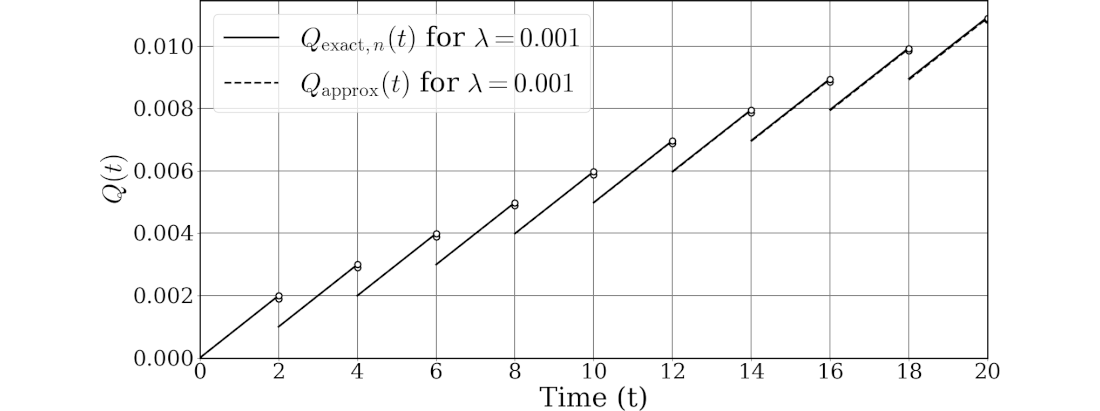
ChatGPTにより $Q_{\text{exact},n}(t)$と$Q_\text{approx}(t)$のグラフ作成プログラムを作成してもらいました。そのリストを示します。
import numpy as np
import matplotlib.pyplot as plt
from functools import lru_cache

plt.rcParams['font.family'] = 'serif'
plt.rcParams['mathtext.rm'] = 'Times New Roman'
plt.rcParams['mathtext.fontset'] = 'cm'

# パラメータ設定
lambdaVal = 0.1  # 故障率
tau = 2    # 点検期間
K = 0.5    # 修復率
epsilon = 0.00001  # 不連続点の直前を示すために使用する小さい値

# 関数定義
def R(t):
    """信頼度関数"""
    return np.exp(-lambdaVal * t)

def F(t):
    """故障関数"""
    return 1 - R(t)

@lru_cache(maxsize=None)
def Q_n(t, n):
    """Q_nの再帰関数。結果をキャッシュする。"""
    if n == 0:
        return F(t)
    else:
        return

def Q_approx(t):
    """tにおけるQ(t)の近似値を計算する関数"""
    u = t % tau
    return (1 - K) * F(t) + K * F(u)

# グラフ描画
fontsize_axes_label = 24 * 1.8
fontsize_ticks = 16 * 1.8
fontsize_legend = 24 * 1.8

plt.figure(figsize=(18, 11))
# 軸(spines)の線幅を太くする
ax = plt.gca()  # 現在の軸を取得
spine_width = 2  # 軸の線幅
for spine in ax.spines.values():
    spine.set_linewidth(spine_width)

# 凡例用のダミープロット
plt.plot([], [], '-', label=f'$Q_{{\\text{{exact}},n}}(t)$ for $\\lambda = {lambdaVal}$', color='black')
plt.plot([], [], '--', label=f'$Q_{{\\text{{approx}}}}(t)$ for $\\lambda = {lambdaVal}$', color='black')

# 不連続性を示すために各区間を個別にプロット
for i in range(10):
    start = i * tau
    end = (i + 1) * tau -epsilon # epsilonを削除
    t_vals = np.linspace(start, end, 200)
    Q_exact_vals = [Q_n(t, i) for t in t_vals[:-1]]  # 区間の最後の点を除外してプロット
    Q_approx_vals = [Q_approx(t) for t in t_vals[:-1]]

    plt.plot(t_vals[:-1], Q_exact_vals, 'k-', lw=2.5)
    plt.plot(t_vals[:-1], Q_approx_vals, 'k--', lw=2.5)

    # 区間の終わりに白丸をプロット
    plt.plot(end, Q_n(end, i), 'o', mfc='white', mec='black', mew=2, markersize=8)
    plt.plot(end, Q_approx(end), 'o', mfc='white', mec='black', mew=2, markersize=8)

plt.xlabel('Time (t)', fontsize=fontsize_axes_label)
plt.ylabel('$Q(t)$', fontsize=fontsize_axes_label)
plt.xticks(np.arange(0, 11*tau, tau), fontsize=fontsize_ticks)
plt.yticks(fontsize=fontsize_ticks)
legend = plt.legend(fontsize=fontsize_legend)
for handle in legend.legendHandles:
    handle.set_linewidth(2.5)  # ここで線の太さを指定
plt.grid(True, color='gray', linestyle='-', linewidth=1.4)
plt.ylim(bottom=0)
plt.xlim(0,10*tau)
plt.subplots_adjust(left=0.14, bottom=0.14)
plt.show()
図762.1に実行結果を示します。これは論文に掲載したグラフの一部です。
なお、
に掲載しています。さらに、
- 新方式によるPUDの導出については先記事#766
に続きます。
なお、本稿はRAMS 2025に投稿予定のため一部を秘匿しています。

Leave a Comment